
Vector addition/subtraction using GC
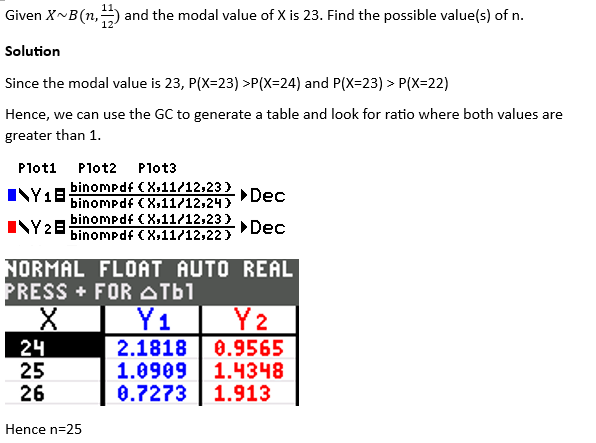
A course takes in exactly 10 students. On average, a student has p% chance of achieving a distinction.
Given that the probability 7 students scoring distinction is greater than the probability of any other number of students scoring distinction, find the possible range of values of p.
Solution
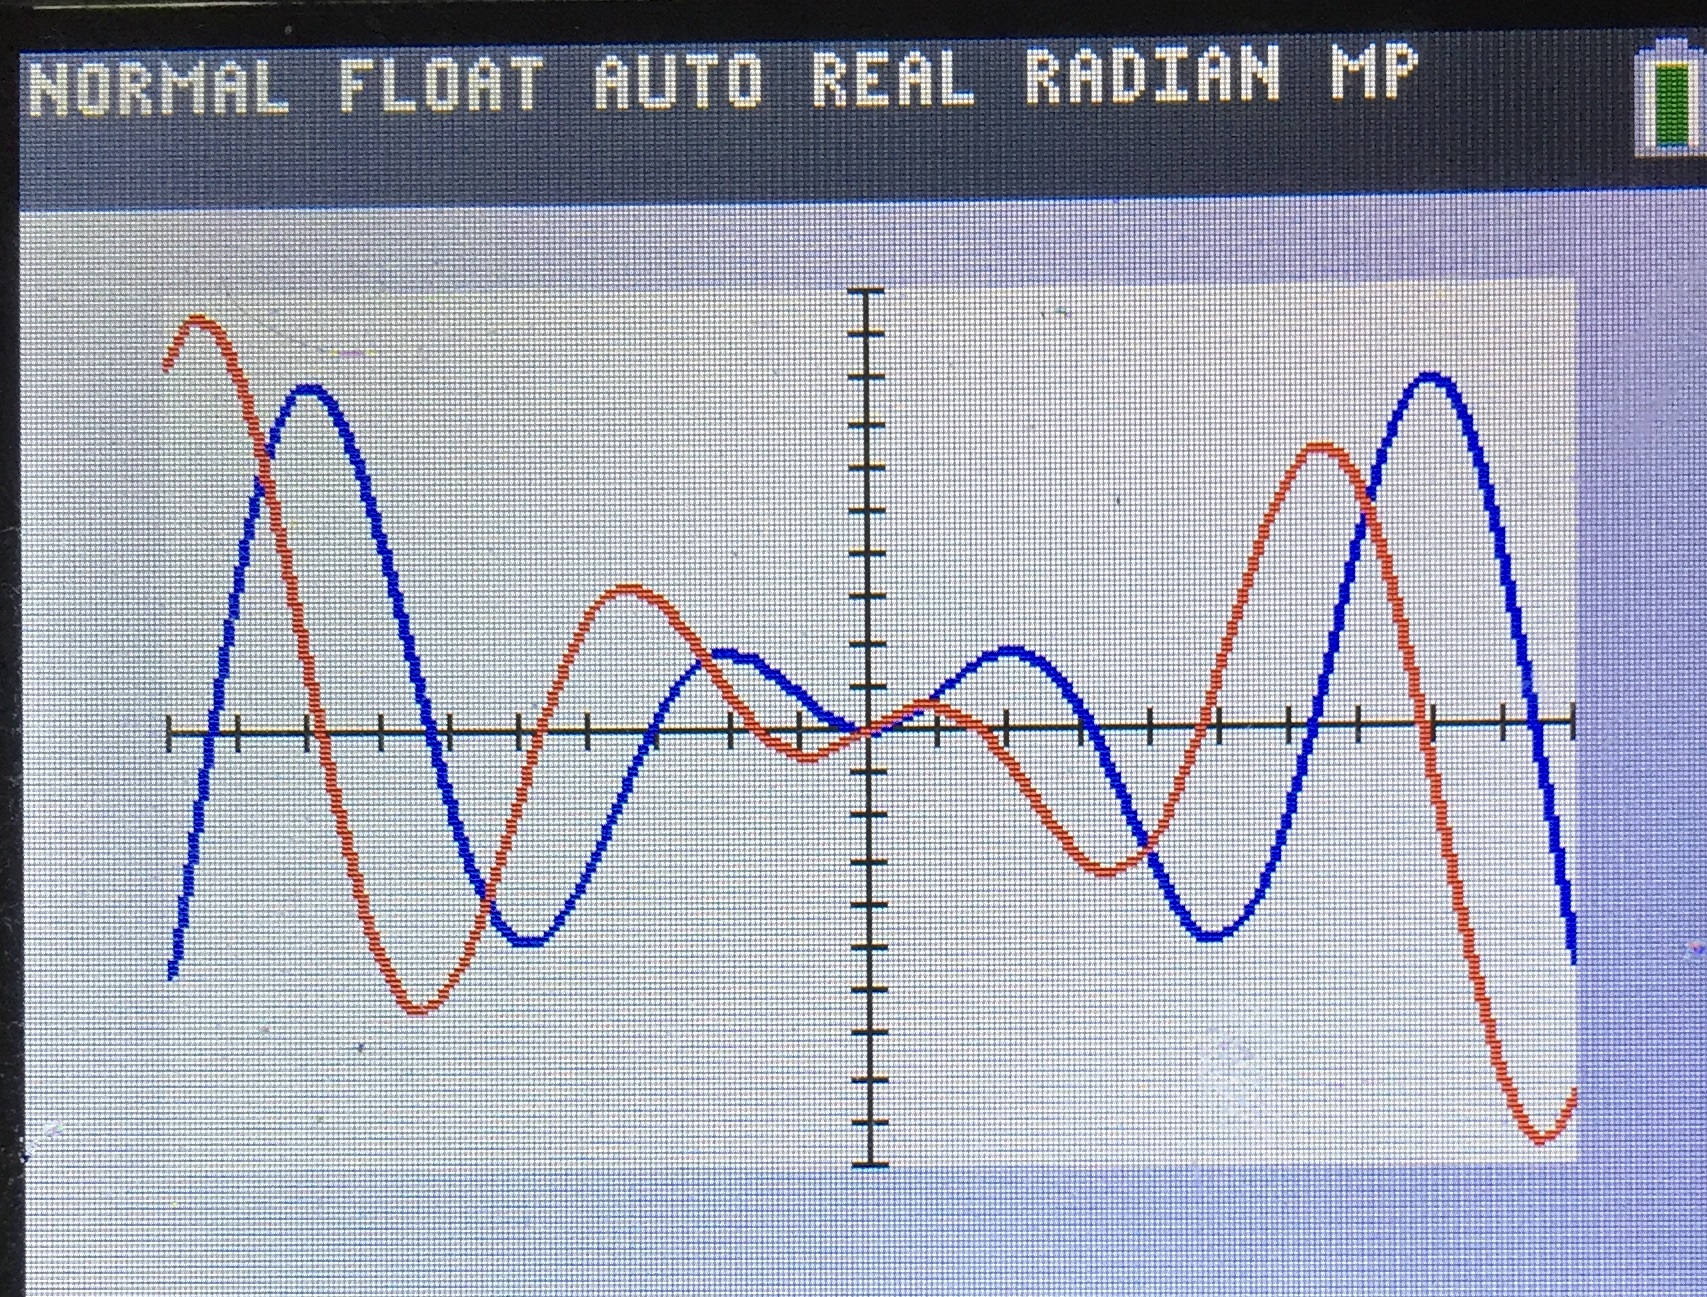
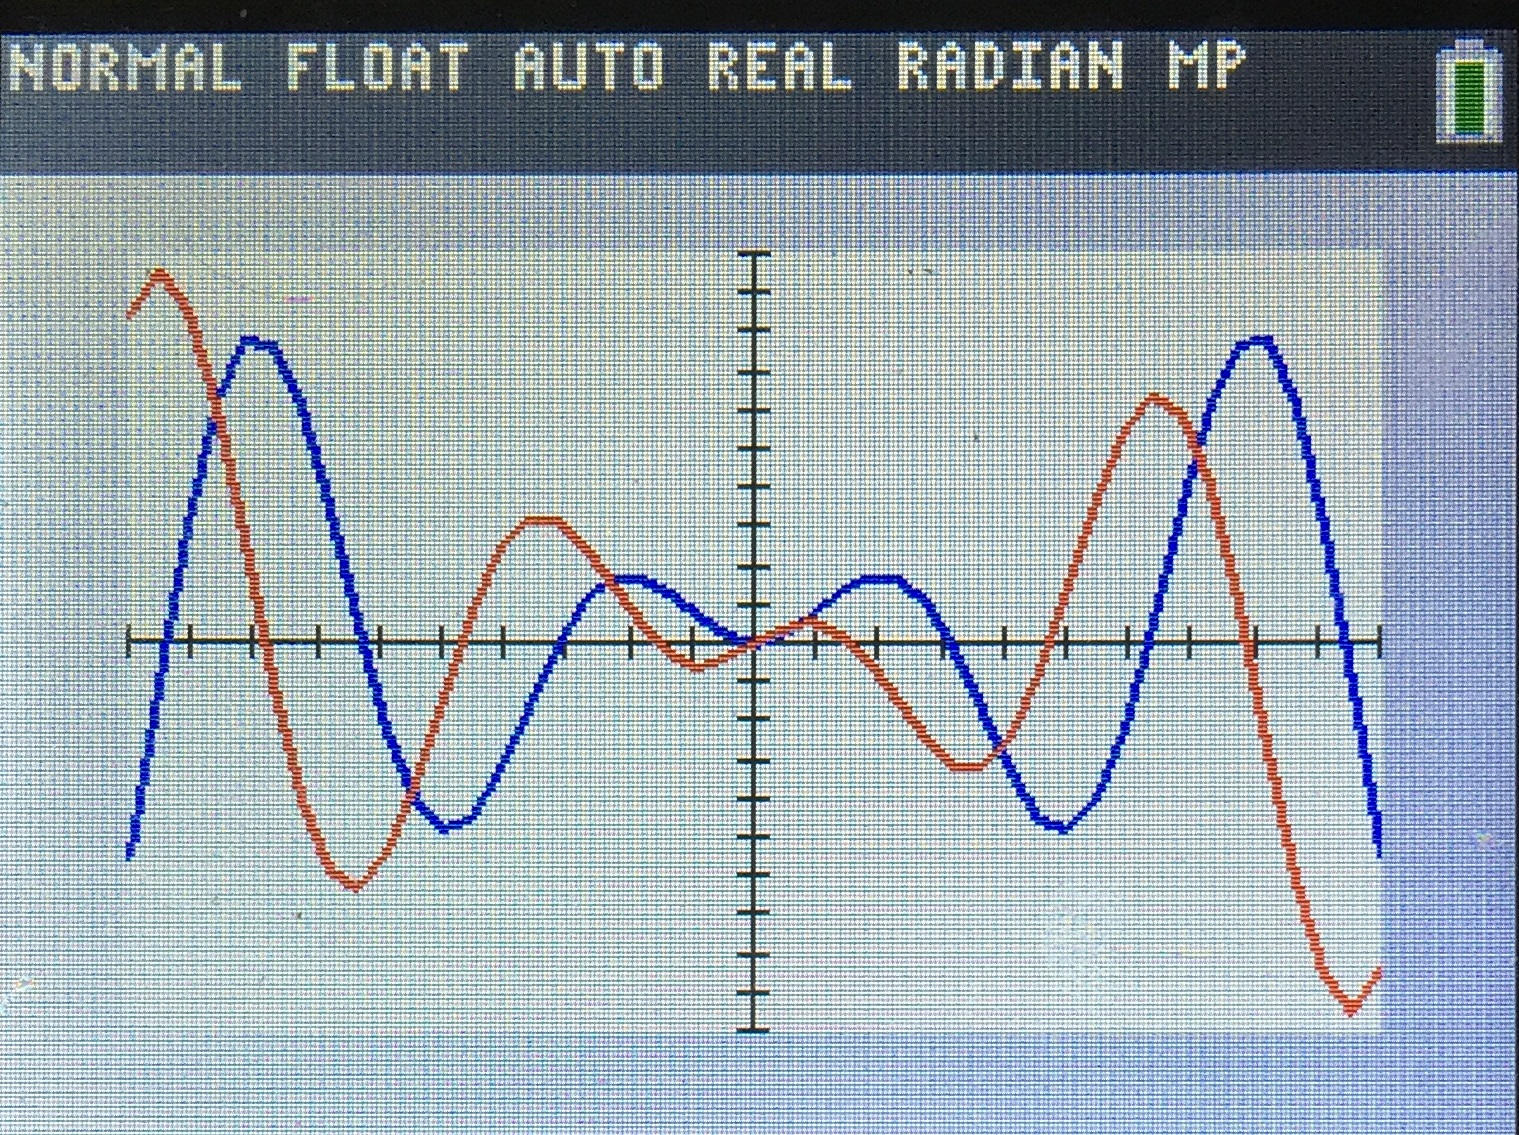
Since the question did not ask for exact values of p, we can use the GC to solve this question.
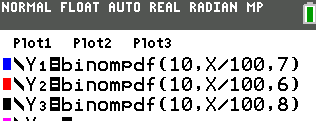
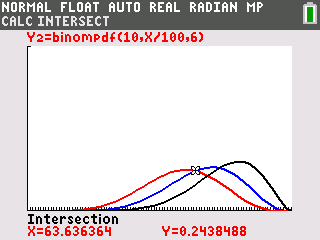
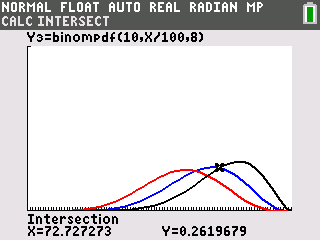
We are looking at where the blue graph is above the red and black graph.
Hence 63.6<p<72.7

Example

Suppose we want to sketch the curve C and the line y=-2x+2 on the same graph
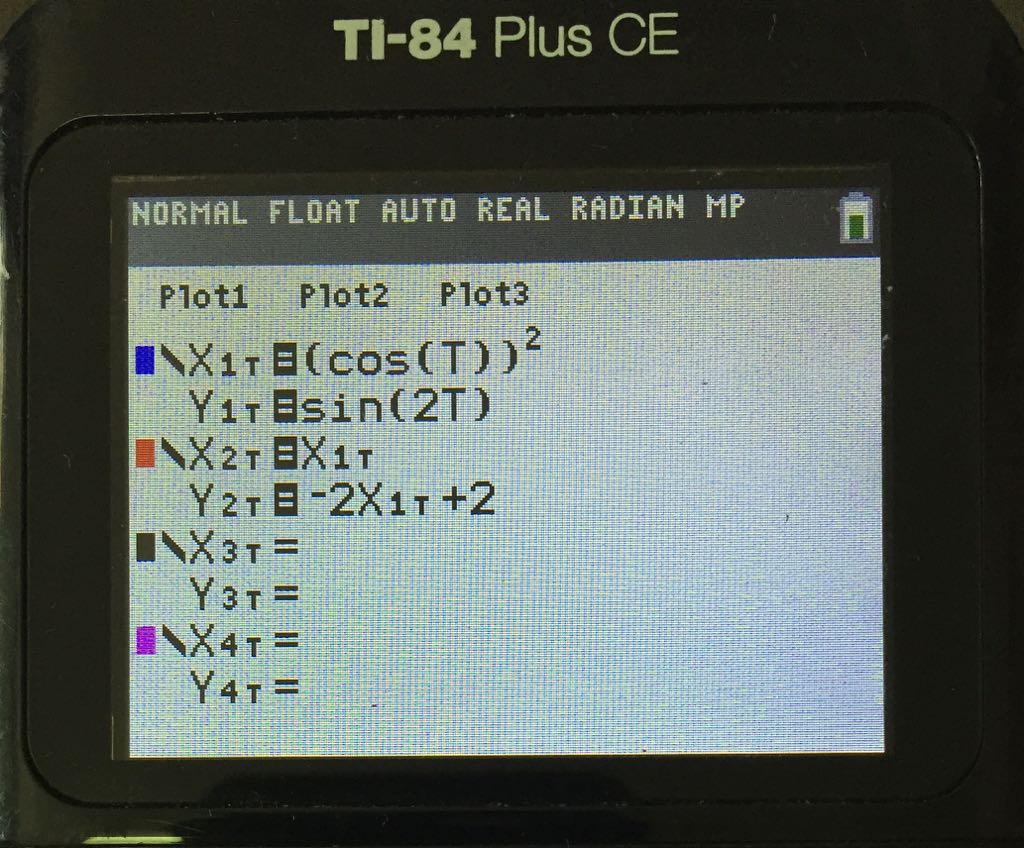
Note how the line y-2x+2 is entered.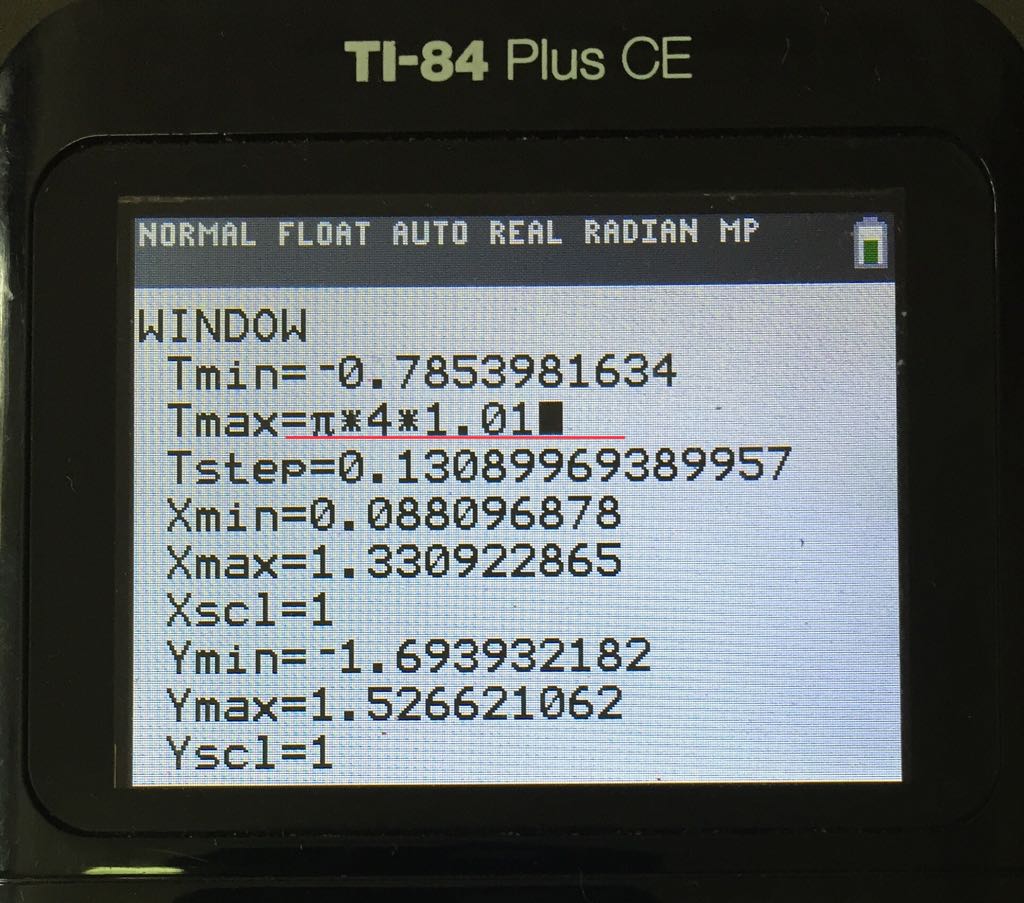
Adjust the Tmax to 1% more so the graph displays correctly.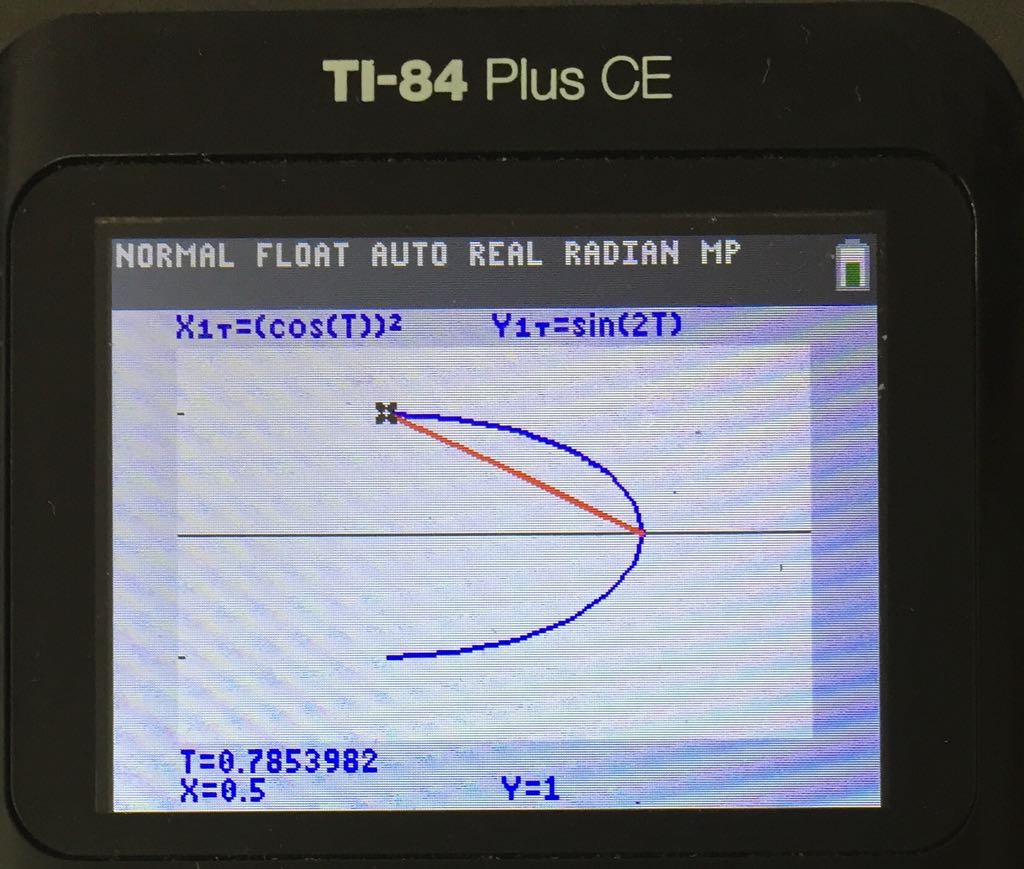

Suppose we want to sketch the graph from -3 to 8.

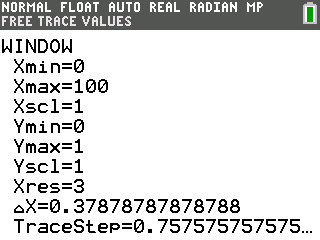
2. Adjust the window setting to the required domain.

3. Trace the end point at -3 since it is not 1 complete cycle.

The following comparison are based on
TI 84 CE: Operating system 5.3.0
TI 84 Plus C: Operating system 4.2
Singapore Approved Operating System
.

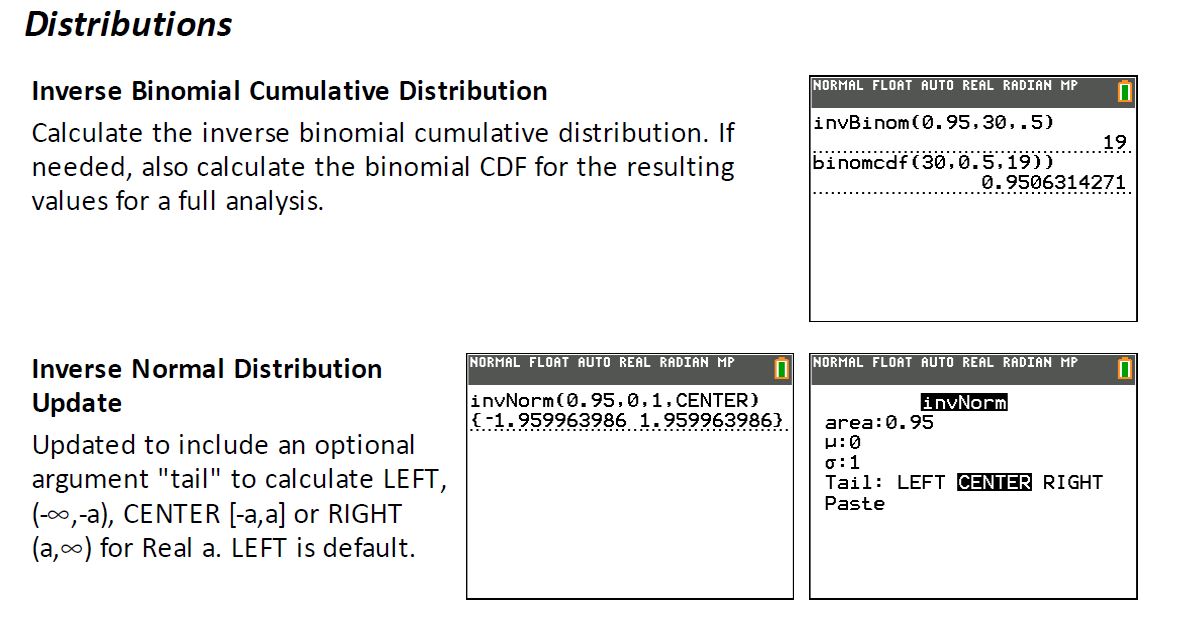
New CONDITIONS submenu in “2nd test” allows faster entry of intervals for the piecewise functions


Conclusion
There are no major functional differences between TI 84 Plus CE and TI 84 Plus C. For piecewise functions, students should learn how to sketch manually without using the GC.
Example 1
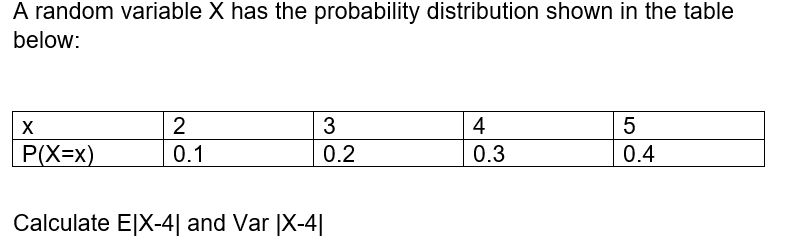
Solution
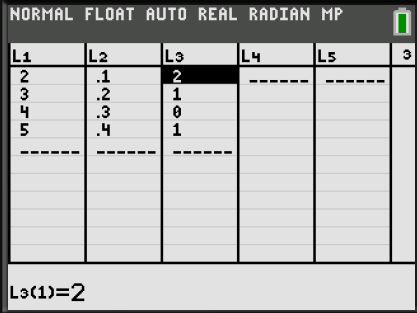
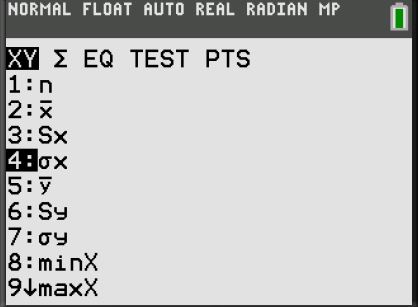
Enter the data in the GC as follows:
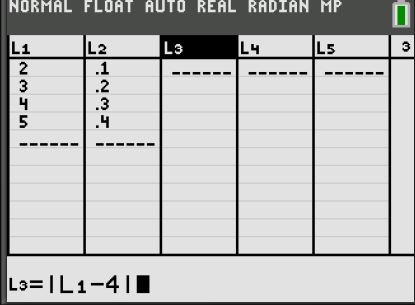
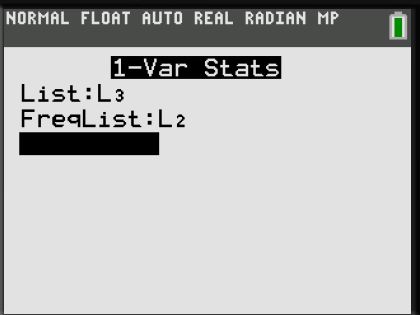
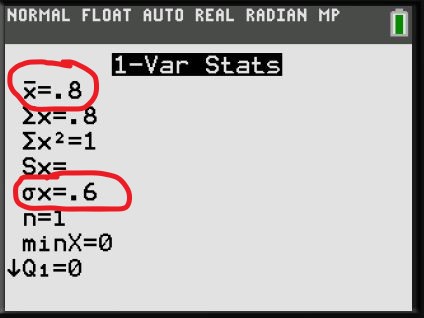

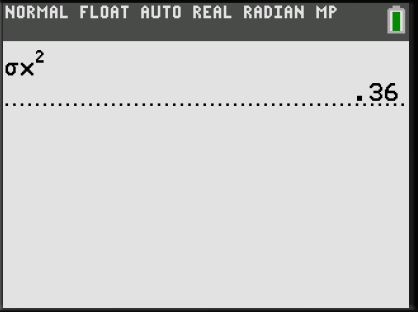
Variance can also calculated using the GC as follows:
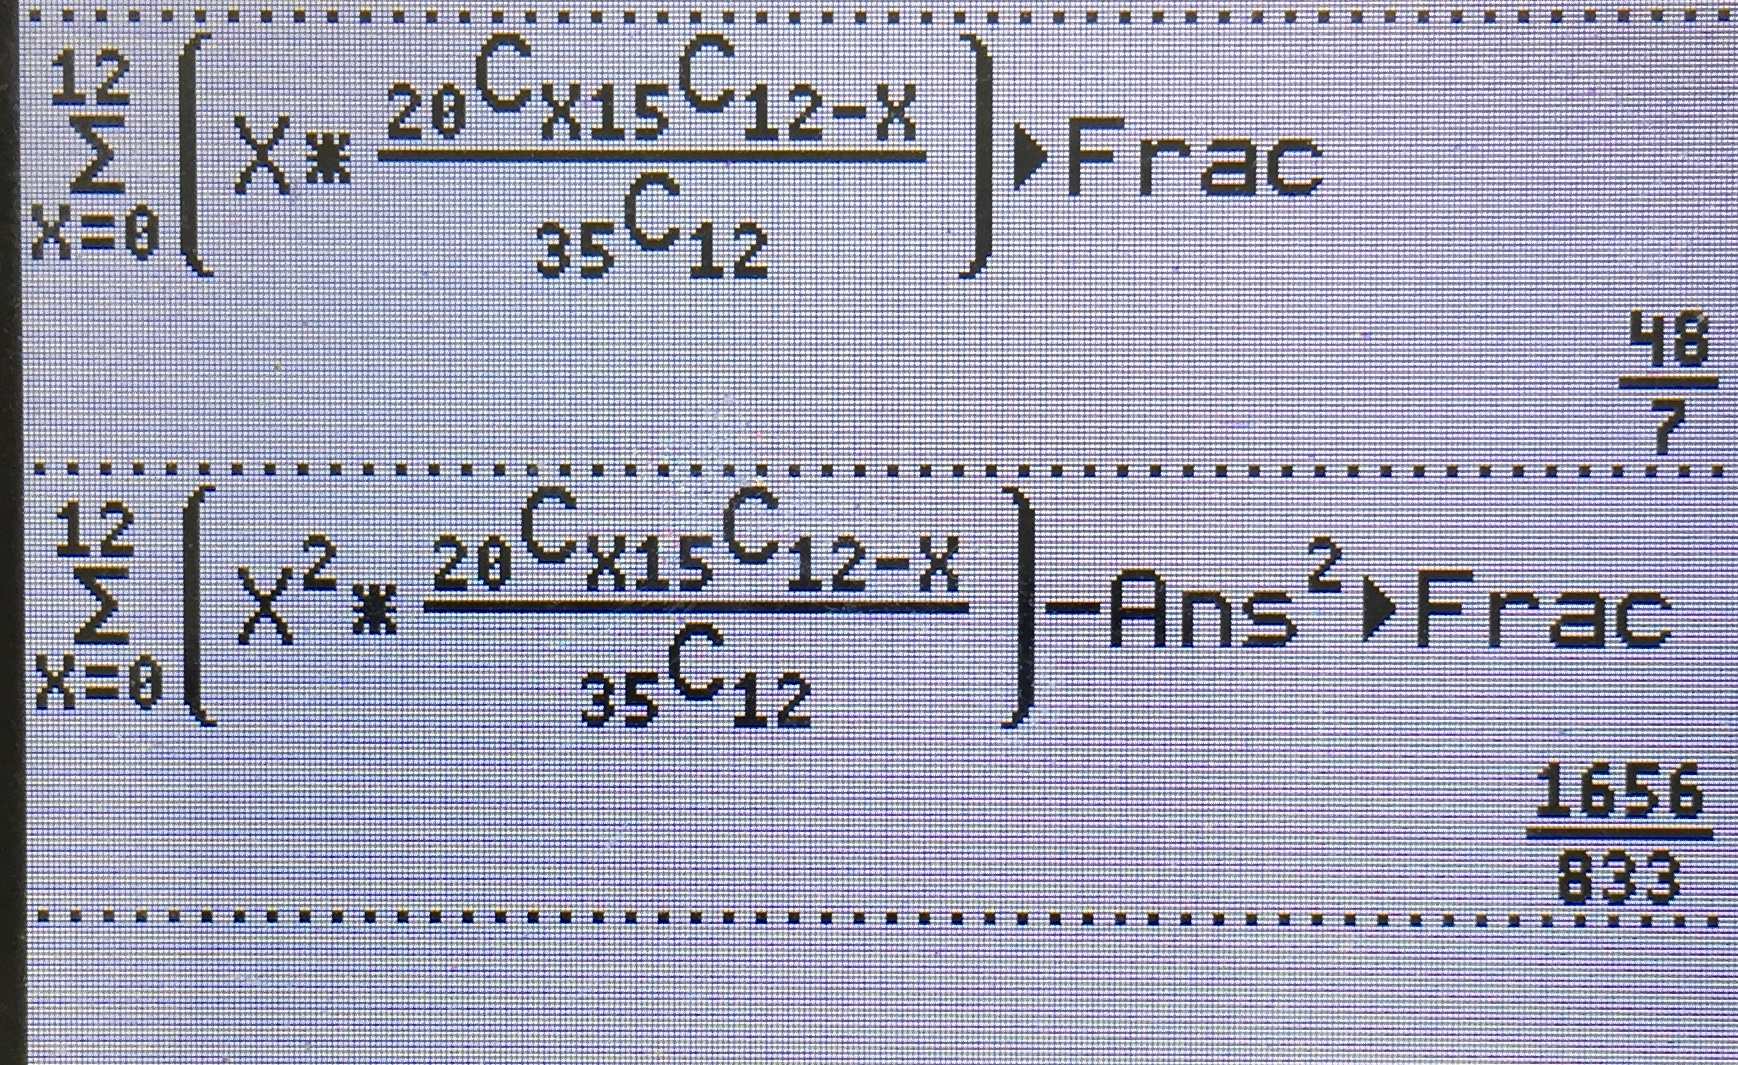
Example 2


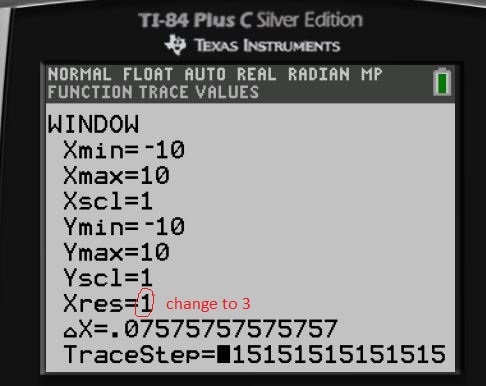
Method 1: Change Xres to 3
The Xres button refers to pixel resolution (1 through 8). At Xres = 1, functions are evaluated and graphed at each pixel on the x-axis. At Xres = 8, functions are evaluated and graphed at every eighth pixel along the x-axis. Small Xres values improve graph resolution but may cause the calculator to draw graphs more slowly. Setting Xres to 3 provides good balance between speed and resolution.
Example

Xres= 1
Time taken to plot= 23.4 s
Xres= 3
Time taken to plot= 3.6 s
Savings of almost 20 seconds! Which is crucial in exams
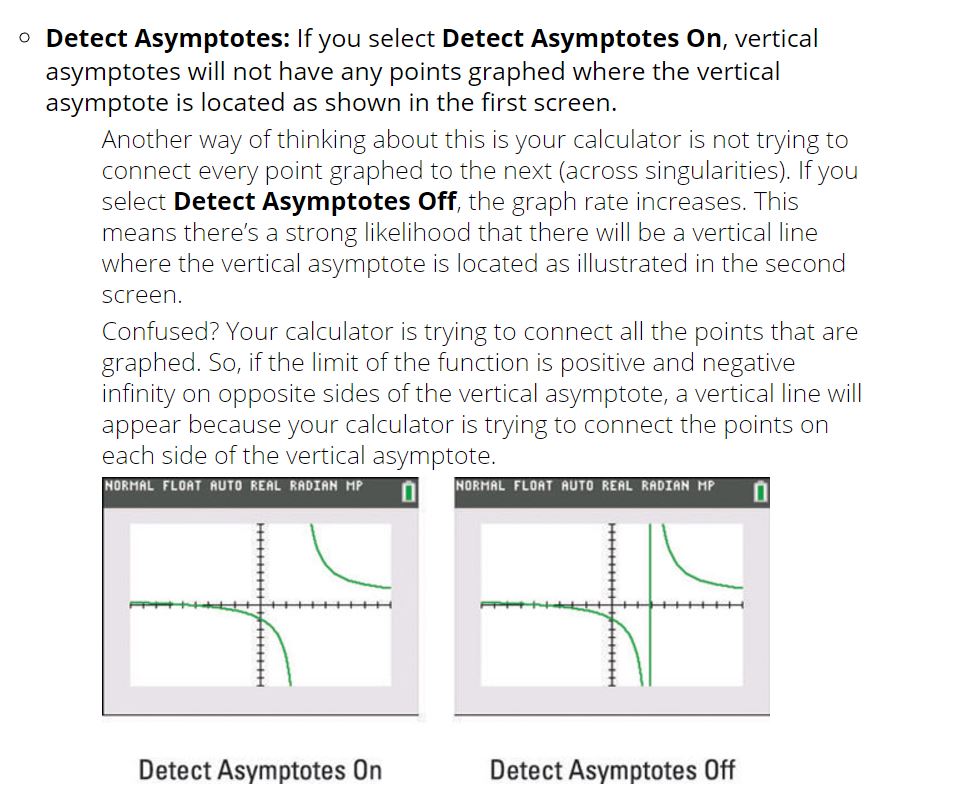
Method 2: Turn off “Detect Asymptotes”


You must be logged in to post a comment.