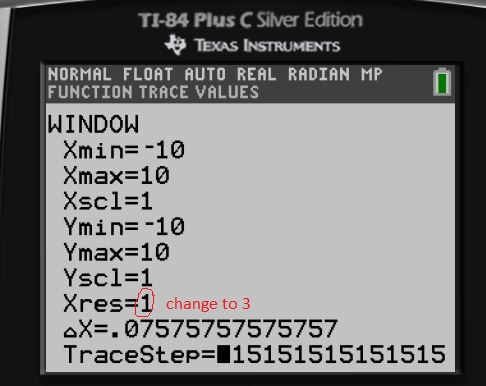
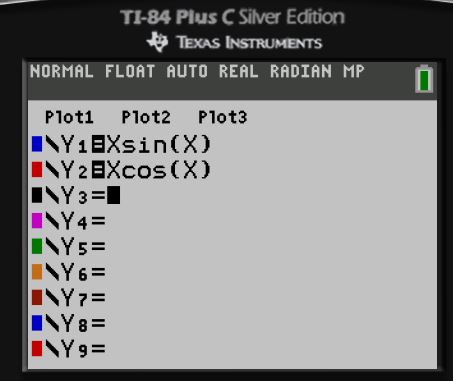
Method 1: Change Xres to 3
The Xres button refers to pixel resolution (1 through 8). At Xres = 1, functions are evaluated and graphed at each pixel on the x-axis. At Xres = 8, functions are evaluated and graphed at every eighth pixel along the x-axis. Small Xres values improve graph resolution but may cause the calculator to draw graphs more slowly. Setting Xres to 3 provides good balance between speed and resolution.
Example
Xres= 1

Time taken to plot= 23.4 s
Xres= 3
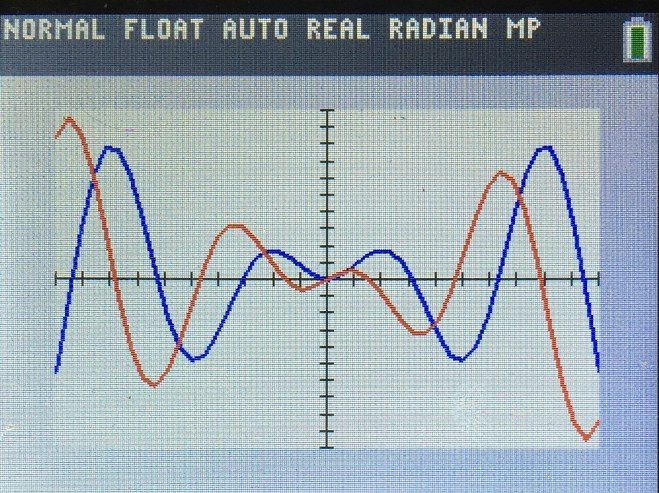
Time taken to plot= 3.6 s
Savings of almost 20 seconds! Which is crucial in exams
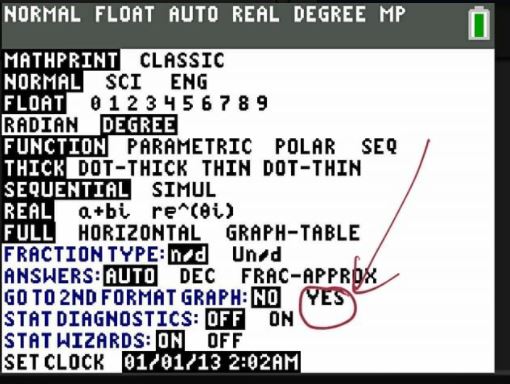
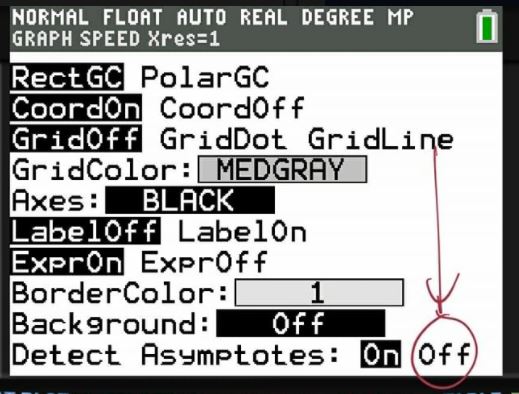
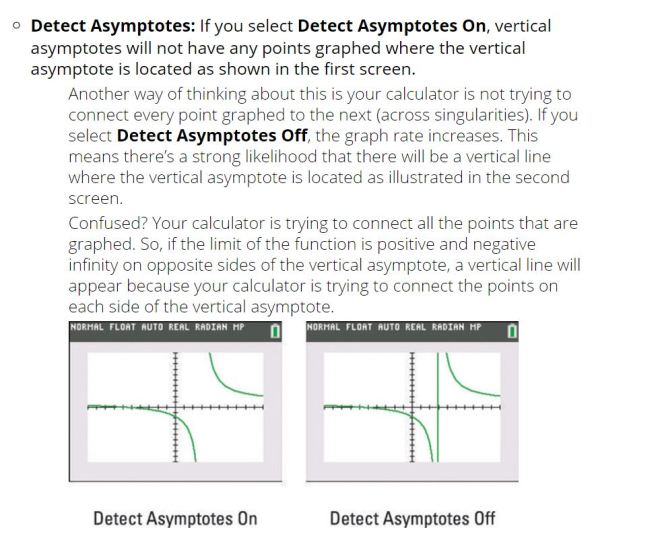
Method 2: Turn off “Detect Asymptotes”