Example
Suppose we want to sketch the curve C and the line y=-2x+2 on the same graph
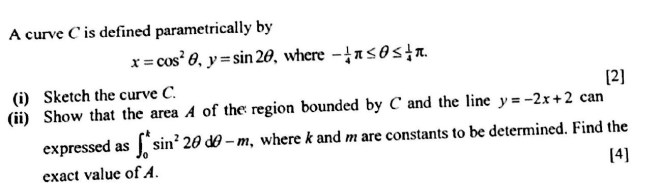
Note how the line y-2x+2 is entered.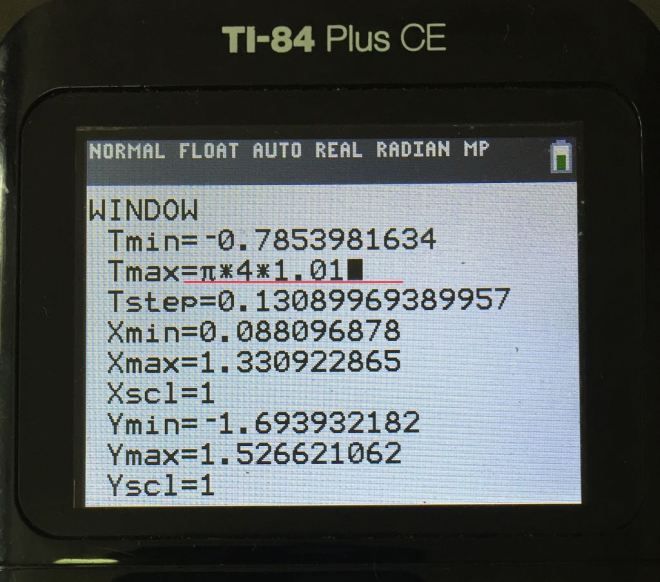
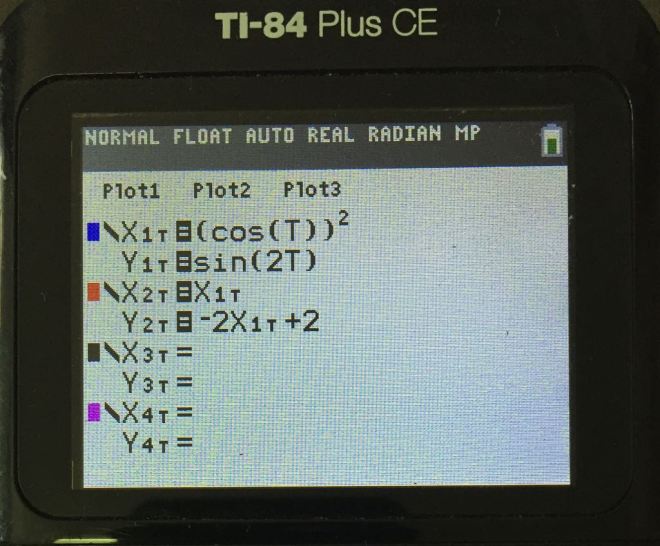
Adjust the Tmax to 1% more so the graph displays correctly.
Example
Suppose we want to sketch the curve C and the line y=-2x+2 on the same graph
Note how the line y-2x+2 is entered.
Adjust the Tmax to 1% more so the graph displays correctly.
