
Vector addition/subtraction using GC
2024 J1 students taking h2 maths alevel in 2025 will be affected by the changes in syllabus.


My VJC student scored 60/80 (75%, A) for J2 Mar CT. Usually most VJC students don’t do well for J2 Mar CT because it was before the mar 1 week holiday, so most students don’t have time to finish all the school practice papers and topical revision. She only did 1 practice paper plus a few selected questions from the remaining 2 papers.
By 16 Mar 2024, we have covered until Discrete Random Variable in the group tuition. The plan is to finish the whole syllabus before end of June holiday.
A good H2 Maths tutor should embody the following qualities:
If you are seeking a good H2 Maths tutor, feel free to contact me.
In 2023, I have one VJC and one NYJC student in the same group.
Common J1 topics: System of linear equations, inequalities, graphing, transformation, techniques and applications of differentiation, series expansion, conics, summation, APGP, functions
These are the topics that are tested in one JC’s promo but not the other:
VJC: integration techniques, complex numbers
NYJC: vectors
So I covered all the common J1 topics and also integration techniques, complex numbers and vectors in the same group tuition. The VJC student learnt vectors (VJC J2 topic), and the NYJC student learnt integration techniques (post promo J1 topic) and complex numbers (J2 topic). In order to cover more topics than their school promo, I have to teach at a faster pace than their school, with only two hours tuition weekly.
Both students managed to score A in promo and even learnt in advance J2 topics.
In 2023 alevel P2, one of the challenging question is to find the center of circle passing through 3 points. The 3 points form an isosceles triangle. Hence the center of circle will lie on a line passing through one of the vertices.
Alevel has the tendency of making the question harder in subsequent years, just like 2018 probability bug question becomes 2022 probability counter question. So students must be prepared to find the center of circle passing through any 3 points.
Practice question: Find the center of circle passing through (1,2,3), (2,1,4) and (3,4,5)
Answer: (17/8,11/4,33/8)
Hints
Let the 3 points be A, B, C and the center of circle be P (x,y,z)
Find the cartesian equation of plane ABC: -x+z=2
Since P lies on plane ABC, P fulfill equation of plane ABC, -x+z= 2 (Equation 1)
AP=BP (radius of circle)
(Steps are left out for students to try)
This reduces to 2x-2y+2z=7 (Equation 2)
AP=CP (radius of circle)
(Steps are left out for students to try)
This reduces to x+y+z=9 (Equation 3)
Solving the 3 equations, this gives x= 17/8 , y=11/4, z=33/8
Hence coordinates of P = (17/8,11/4,33/8)
I tutored a VJC student after he got 46% for J1 MYE, 20-40 percentile. Since 6 in 10 VJC students got A in alevel 2023, tuition helped him improved to at least 40 percentile to get A in 2023 alevel

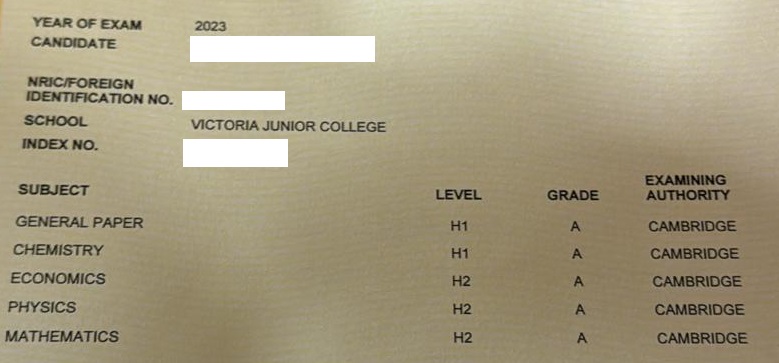
Over the years, I have tutored many VJC and TJC students. If they start tuition shortly after J1 MY or promo and their results are at least 20-40 percentile before tuition, it is highly possible they can get A in alevel.
A course takes in exactly 10 students. On average, a student has p% chance of achieving a distinction.
Given that the probability 7 students scoring distinction is greater than the probability of any other number of students scoring distinction, find the possible range of values of p.
Solution
Since the question did not ask for exact values of p, we can use the GC to solve this question.
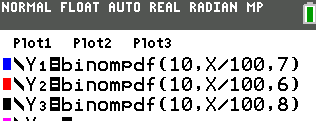
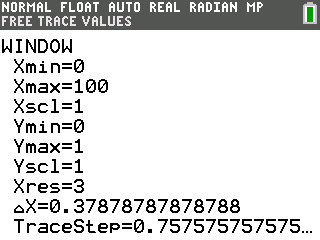
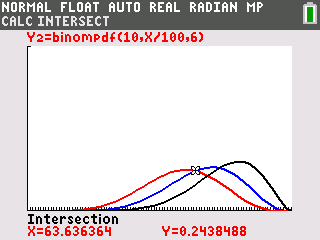
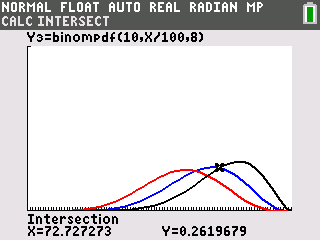
We are looking at where the blue graph is above the red and black graph.
Hence 63.6<p<72.7
My VJC student improved from 69% J1 MYE to 85% in promo, topping her class. She was given 5 promo practice papers by her school. What I did is to select the more challenging questions from her promo practice paper to do, and then we go through J2 prelim questions that are relevant in promo.
Because from my past experience, if this year promo paper turns out to be much harder than the previous, then students who merely practice the promo practice papers will not do well this year. Doing just promo practice papers will give just average results since that is what the majority of students are doing. To shine in class, a student needs to master beyond the difficulty level in promo practice papers.


You must be logged in to post a comment.